

 Reports
Interactive reports help you make better decisions
Visualize key metrics. Dive into the details. Slice n dice your data. Take meaningful actions!
Conversation Report
Understand what your customers are having trouble with and identify any trends.
Key metrics
- Number of new conversations
- What times of the week are busiest
- Categorization of conversations
- Top 10 labels or canned responses used


Performance Report
Measure the work that your team is doing. Identify and plan for busy periods.
Key metrics
- How many issues were resolved
- Number of customers helped
- What are your response times
- When is the team most active
Team Report
Identify the strongest team members and those that need more training.
Drill down on performance details for each team member.


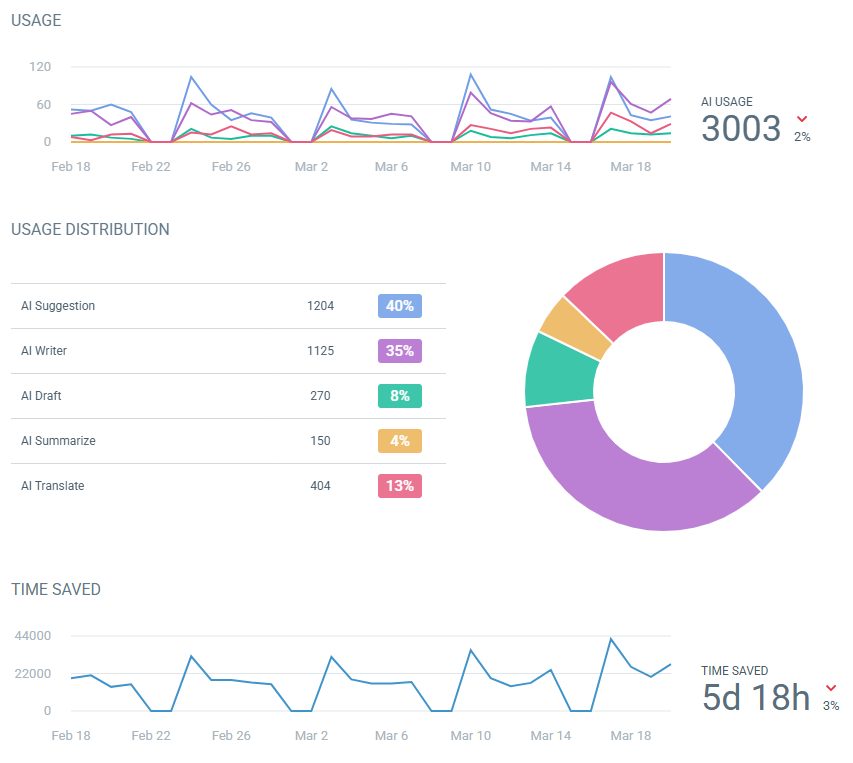

AI Report
View breakdown on all the ways Enchant AI features provide a productivity boost to your team.
See how much time was saved and which users had the most efficient resolutions.
Happiness Report
Get a grasp on customer sentiment.
Identify which interactions delighted customers, and those that need more attention.
